
Multifamily Rent Growth and Occupancy for 2020
By Christopher Levarek
“It is not the strongest or the most intelligent who will survive but those who can best manage change.”
- Leon C. Megginson
Yardi Matrix recently released their August 2020 report, “Yardi Matrix National Multifamily Report” detailing rent growth across the United States. This report highlights specific cities when compared to the overall current national average -0.3% as of the time of the report. Rent growth is typically a good sign for a landlord or rental property investor as this means higher demand and lower occupancy rates with increased cash flow opportunities.
Yardi Matrix classifies “Lifestyle” asset classes or rentals as those renters who could own property but choose to rent instead while the “Renter by Necessity” asset class are those who rent because they do not have another option.
In the below graph, we can see that Year of Year rent growth for both these asset classes combined for 2020 year-to-date is strongest in Indianapolis, Inland Empire(East L.A.), Phoenix, Sacramento and Kansas City.
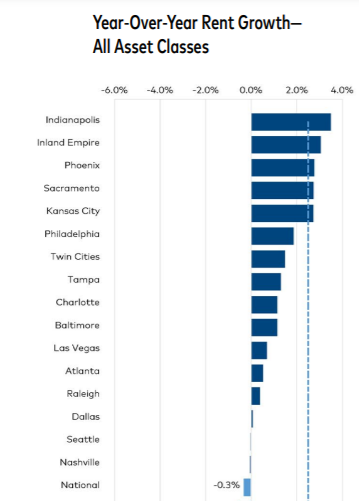
Source : YardiMatrix
When we look at Year-over-Year rent growth for “Renter-By-Necessity” we see a slightly different picture as now Phoenix, Indianapolis and Sacramento, Inland Empire, Atlanta and Philadelphia are showing the highest YoY rent growth in this asset class as seen below:
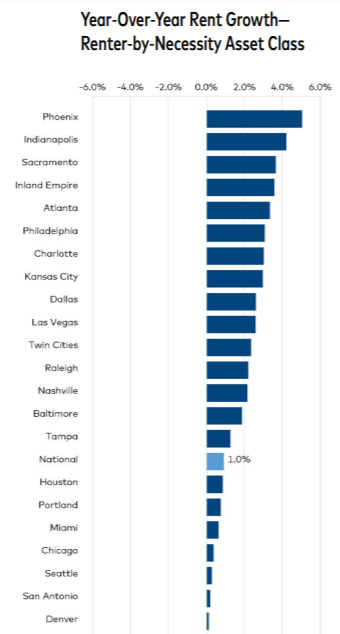
Source : YardiMatrix
When we look at Year-over-Year rent growth for the “Lifestyle” asset class we see another view point as now Kansas City, Inland Empire, Indianapolis and Sacramento are showing the highest YoY rent growth in this asset class.
Notice how Philadelphia and Raleigh did not have rent growth increases in this asset class but rather decreases whereas in the “Renter by Necessity” asset class these locations had increases in rent growth.
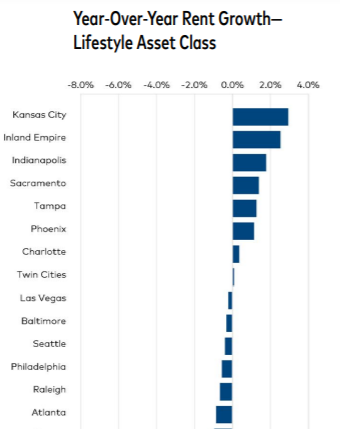
Source : YardiMatrix
With all the shelter-in-place government enforcement of 2020 and the correlating high unemployment numbers, let’s look at which cities have had to decrease rents or have had the sharpest drop in rents.
According to the below data, representing from left-to-right “All Asset Classes, Lifestyle and Renter By Necessity”, we see that San Jose, San Francisco, Boston and Los Angeles have seen the most rent decreases or negative rent growth.
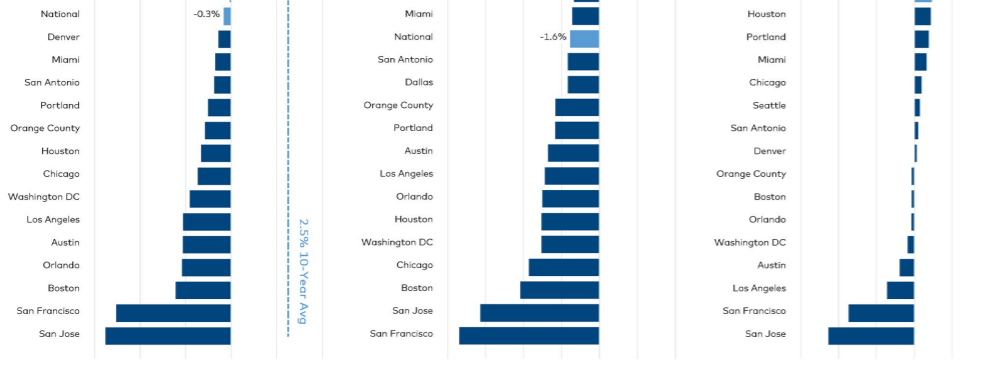
Source : YardiMatrix
Finally, we can view some of the Occupancy Rates for these cities when looking at July of 2019 versus July of 2020. As is noticeable, occupancy rates are not down by much for these listed markets which contrasts greatly to the expectations from many real estate property owners expressed in March of 2020.
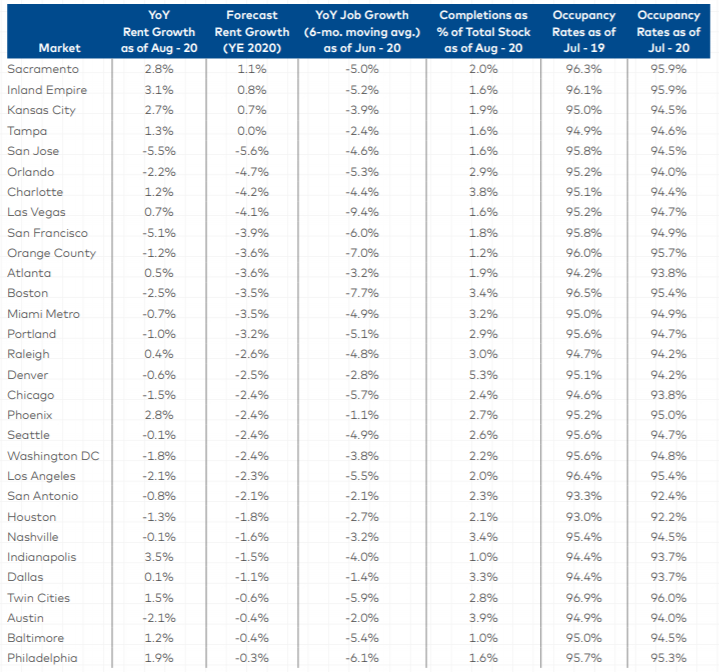
Source : YardiMatrix
In Final
2020 has been an interesting year and we still have a few months to go. Rent growth and occupancy rates have been affected but as the data shows, people still need a place to live despite market conditions. Forecasting correct market migration patterns and providing quality affordable living will continue to be most effective for multifamily real estate owners as we face the future together. Invest Smart!